CD DISC 2.0 Contrast Detail Phantom
Most definitions of image quality in radiology are based on characterizing the psychical properties of the image chain. However, medical diagnosis is not made by the image alone, also the perception by the observer is crucial for the result. A test of the observers perception is possible with so called Contrast-Detail (CD) phantoms. With a CD-phantom it is possible to quantify both, details and contrasts, as observed by the radiologist.
The CD DISC 2.0 phantom is especially designed for the evaluation of fluoroscopes.
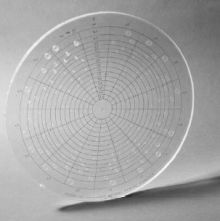
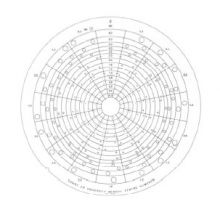
Construction - The CD DISC phantom consists of a plexiglass tablet with cylindrical holes of exact diameter and depth (tolerances: 0.02 mm).Together with additional plexiglass tablets, to simulate the dimensions of the patient, the radiographic image of the phantom gives information about the imaging performance of the whole system (refs. 1 and 2). The image shows 240 curved segments. These segments are formed by 16 concentric rings divided by 15 rays from the center of the rings. In each segment one spot is present, in a randomly chosen corner, being the images of the hole (fig. 1). The optical densities of the spots are higher as compared to the uniform background. Due to the (exponentially) increasing depth of the holes in clockwise direction, (from 0.3 to 8.0 mm) the image shows 15 disc-segments of spots with increasing contrast. From the center towards the edge the diameter of the holes increases stepwise and exponentially from 0.3 to 8.0 mm. For the image this means 16 rings of spots with increasing spatial resolution.
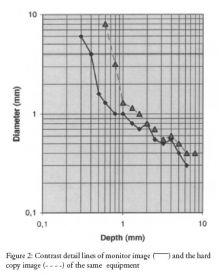
Evaluation - For evaluation of the phantom image the observer indicates the location of the spot in each square. Correct indication proves that a contrast is really seen. At the transition from visible to invisible it is difficult to decide at which position the spot is located and the response equals pure chance. The line connecting the spots with smallest visible diameter and contrast is called the Contrast-Detail (CD) curve. For comparison of the imaging performance of different systems, phantom images are made under identical conditions and evaluated by the same observer and at the same time. The better system will produce an image in which smaller contrasts and details are visible. This results in a shift of the CD-curve to the lower left part of the diagram / graph (see fig. 2) Comparison of the performance of several observers is also possible. The better performing observer produces a CD-curve more to the lower left part of the diagram.
References
1. Thijssen MAO, et al: Quality Analysis of DSA equipment,Neuroradiology (1988) 30: 561-568.
2. Thijssen MAO, Rosenbush G, Gerlach H.J.: Reduction ofexposure in fluoroscopy, Electromedica (198804) 56: 126.133.
3. Rose A: Vision, human and electronic, Plenum, New York,1974.
0695-0119 Contrast-Detail Phantom (CD DISC 2.0)


